Device repository and metrics
This guide explains how to import the lorawan-devices Device Repository and to how to visualize the decoded data directly within the ChirpStack web-interface. In this guide we will use the Tektelic Smart Room Sensor as an example to visualize the temperature and humidity measurements, but it can be easily substituted by any other device present in the repository.
Device Repository
The lorawan-devices Device Repository contains information about many LoRaWAN devices. For most devices a payload codec is included, which makes it really easy as you will immediately see the decoded payload, rather than a binary blob.
ChirpStack provides support for importing this repository into the ChirpStack database. Once imported, you will find the information about these devices under device-profile templates.
Importing
ChirpStack Gateway OS
If you are using the ChirpStack Gateway OS then you can skip this step. During the first boot of the ChirpStack Gateway OS this repository will be automatically imported for you.
Docker Compose
If you are using the ChirpStack Docker Compose example code, then you need to execute the following command to import the repository:
make import-lorawan-devices
Note that this requires that you have the make and git commands installed.
Debian / Ubuntu
If you are have installed ChirpStack using the provided Debian / Ubuntu .deb
packages, then you need to execute the following command to import the
repository:
git clone https://github.com/brocaar/lorawan-devices /tmp/lorawan-devices
chirpstack -c /etc/chirpstack import-ttn-lorawan-devices -d /tmp/lorawan-devices
Note: an older snapshot of the lorawan-devices repository is cloned as the
latest revision no longer contains a LICENSE file.
Connecting the device
Create device-profile
Log in into the ChirpStack web-interface and click Device profiles in the left menu. Then click the Add device-profile button to add a new device profile.
Now that you have installed the Device Repository, there is no need to fill in all the fields by hand. Click the Select device-profile template button instead, and select your device from this list. In case of the Tektelic Smart Room Sensor, we would select:
Tektelic Communications Inc. > Smart Room Sensor Base > FW version: D > EU868
Please make sure to select the template that matches your device and click Ok. This will fill in all the required device-profile fields for you. Now create the device-profile.
Add device
Now add the device as you would normally add a device to ChirpStack. Make sure to select the device-profile that you created in the previous step. Please refer to the Connecting a device guide for instructions about connecting a device.
Validation
Navigate to the device in the web-interface and click the LoRaWAN frames
tab. When you turn your device on, you should see a JoinRequest and
JoinAccept message appear. If this is not the case, then you might have
entered the wrong key(s). Please refer to the
Connecting a device guide for troubleshooting instructions.
Once the device has been activated, navigate to the Events tab. Here you
will find a join event indicating that the device joined the network. As soon
as the devices sends its first measurements, you will see an up event. Open
this event by clicking on the up button. You will now see a JSON structure
containing the full payload. Confirm that it contains the decoded payload under
the object key (you will find this key under the data key).
In case of the Tektelic device, the content of the object looks like this:
{
	relative_humidity: 59,
	ambient_temperature: 28.5,
	battery_voltage: 3.09
}
Visualizing metrics
Once you have completed the previous steps, your device is up and running and ChirpStack is able to decode the payloads. In this step we are going to configure the measurements within ChirpStack. Once configured, ChirpStack will start aggregating the received measurements and will visualize this on the device page in the web-interface.
Configure measurements
In the web-interface, navigate to the device-profile that you have created in the previous steps and click the Measurements tab. You should see a few configuration rows, with the data key and the measurement-kind set to Unknown / unset. When a decoded uplink is received, ChirpStack will automatically add measurements to the device-profile, so that you only have to set the aggregation kind and give it a user-defined name. That is what we are going to do in this step.
For the Tektelic Smart Room Sensor, we are going to configure the
ambient_temperature and relative_humidity measurements which were
automatically added. If you have a different device, then use the measurement
keys that were added for you.
In case of the temperature and humidity, select the Gauge measurement type and give the measurements a human-friendly name. For example Room temperature and Room humidity.
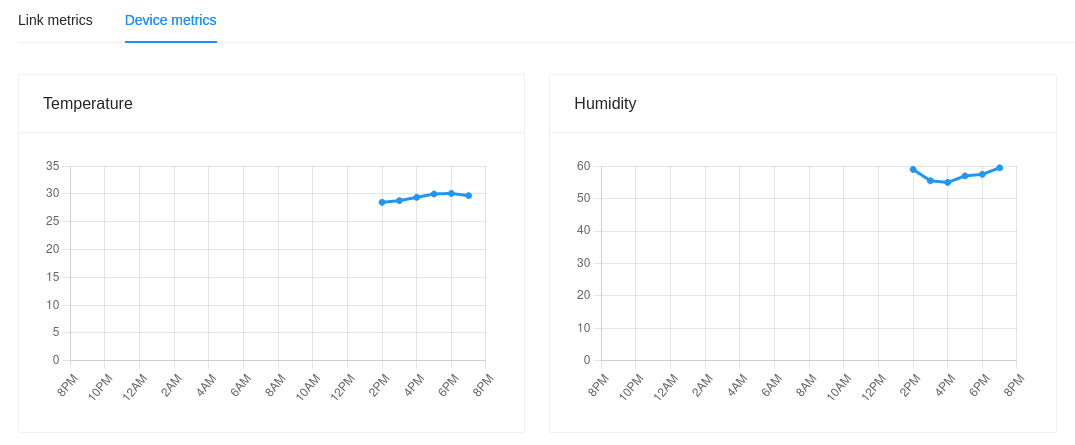
View metrics
From the moment that you have configured the measurements, ChirpStack is going aggregate the data. Data received before the measurements configuration is not aggregated. Therefore it might take some time before data will appear. In case of the Tektelic Smart Room Sensor, it will take up to 15 minutes before new measurements are sent (with the default configuration).
In the web-interface, navigate to the device page. Within the Dashboard tab, click the Device metrics tab. Here you will find the measurements that you have just defined. You can switch between 24h (per hour), 31d (per day) and 1y (per month) interval.